Back

Contents

Downstream P&L: How to Build a Financial Plan for a Refining and Marketing Business

by LumelJuly 1, 2025, |

The downstream sector of the oil and gas industry is a complex, high-volume, and often volatile world. It's where crude oil is transformed into the products that power our lives—gasoline, diesel, jet fuel, and more—and delivered to the end consumer. For any refining and marketing business, mastering the financial plan, specifically the Profit & Loss (P&L) statement, isn't just an accounting exercise; it's the bedrock of strategic decision-making, operational efficiency, and sustainable profitability.

But building a downstream P&L is notoriously challenging. It involves navigating fluctuating crude prices, complex refining processes, vast distribution networks, and fierce retail competition. A simple spreadsheet might buckle under the weight of these variables. This guide will walk you through the core components of a downstream financial plan, illustrating how to build it from the ground up and how modern tools can tame its complexity.

The Two Halves of the Downstream Story: Refining and Marketing

A downstream business is typically a tale of two integrated, yet distinct, operations:

  1. Refining: The industrial heart, where massive refineries process crude oil into a slate of refined products. The primary goal here is to maximize the value of each barrel of crude by producing a high-yield mix of profitable products.
  2. Marketing (or Retail): The customer-facing arm, which involves distributing and selling these products through wholesale channels or a network of retail outlets (gas stations). This side of the business often includes non-fuel revenue from convenience stores, adding another layer to the P&L.

A robust financial plan must model these two segments separately before consolidating them into a total downstream P&L. Why? Because they have fundamentally different revenue drivers, cost structures, and key performance indicators (KPIs).

Building the P&L: A Step-by-Step Guide

Let's break down the construction of a downstream P&L, starting from the top line (revenue) and working our way down to the bottom line (net income).

1. Forecasting Revenue: It Starts with Volume and Price

Revenue in the downstream sector is a classic Volume x Price equation, but the details are what matter.

Refining Revenue

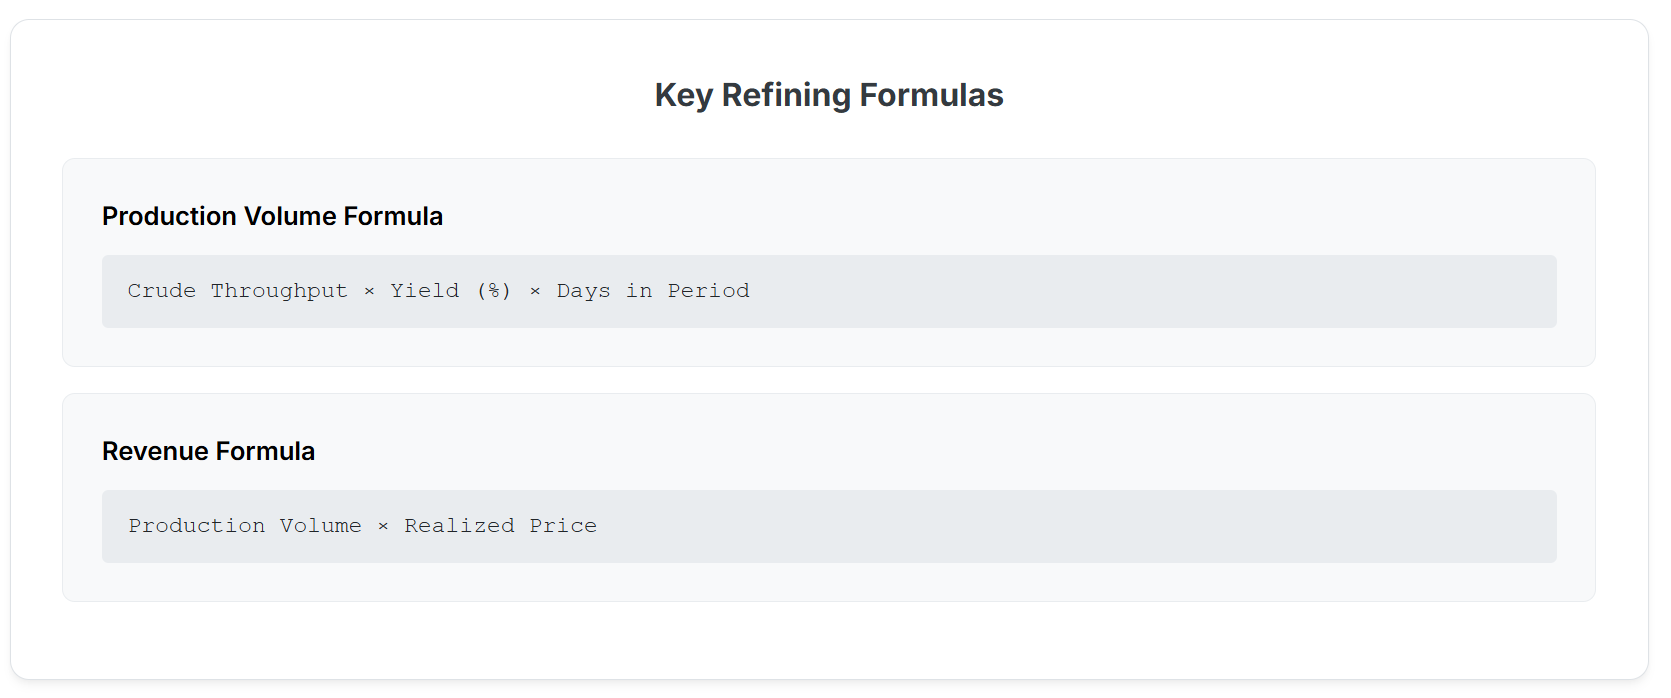
The refinery doesn't just sell one product; it sells a "slate" of them. Your plan must forecast the production volume and sales price for each key product.

  • Production Volume: This is driven by the refinery's crude throughput (how many barrels of crude it processes per day) and its production yield for each product. The yield isn't fixed; it can be adjusted based on the type of crude being processed and the operational configuration of the refinery, which is often optimized to meet seasonal demand (e.g., more gasoline in the summer).
  • Sales Price: Refined product prices are benchmarked against market indices (e.g., U.S. Gulf Coast CBOB for gasoline). Your forecast will involve applying a differential (a premium or discount) to these benchmark prices based on local market conditions and logistics.

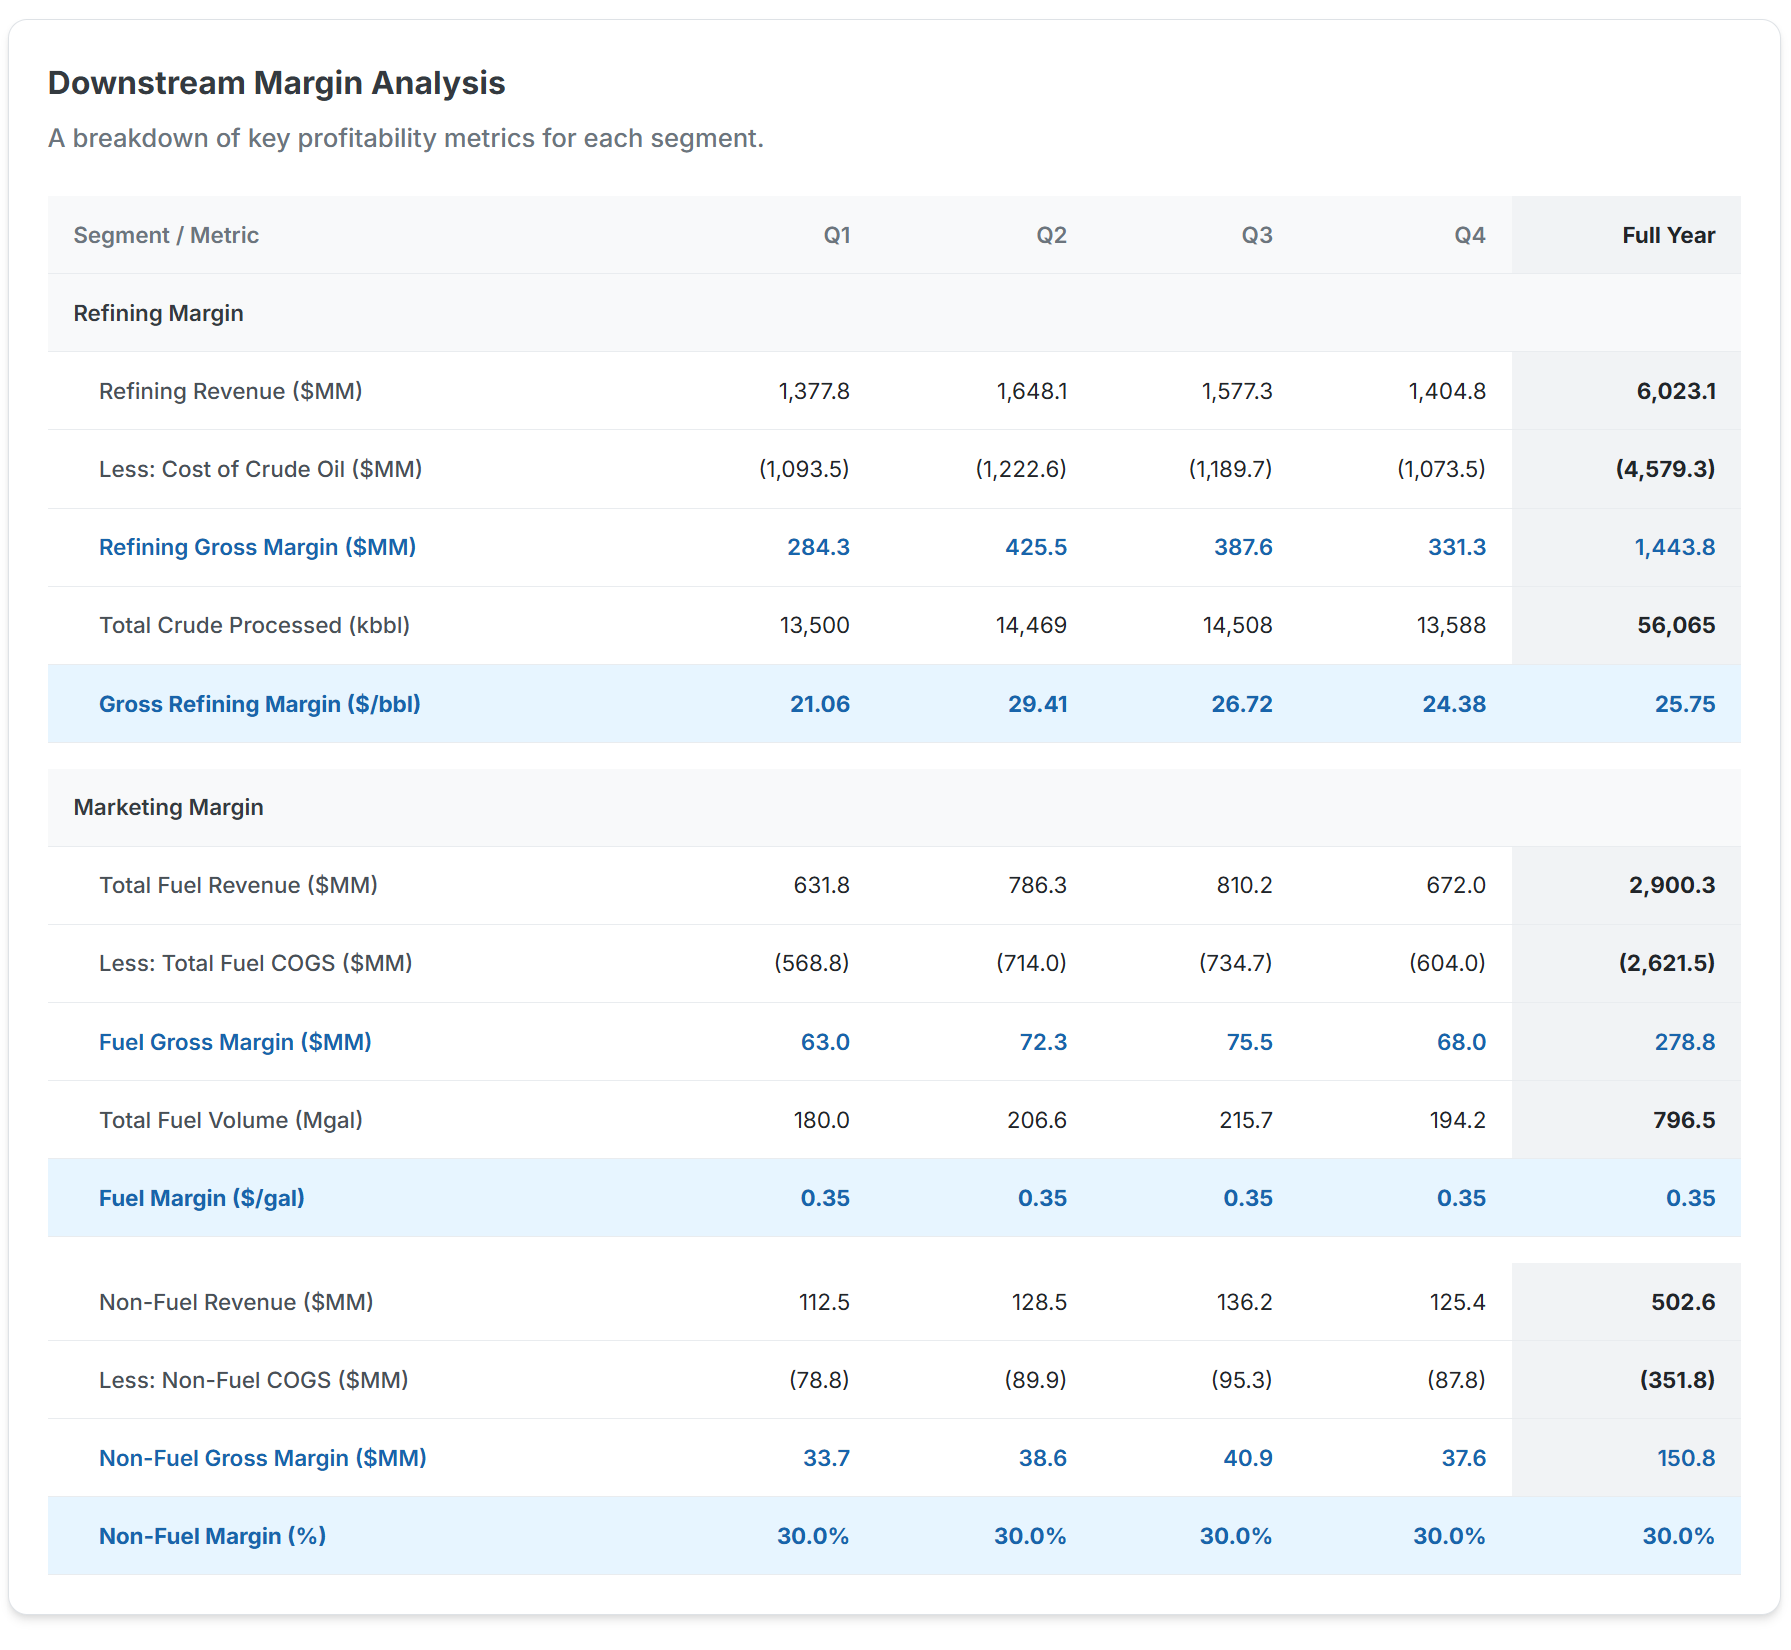
Here is an example that showcases how production volume and revenue are calculated for one product. Revenue for other products is calculated in a similar manner. The user can view the metrics for other products by changing the product selection. The total refining revenue from all the products is given at the bottom of the image.

Here are the formulae used for calculating production volume and revenue.

Marketing Revenue

The marketing segment has two main revenue streams: fuel and non-fuel.

  • Fuel Revenue: This is more straightforward. It’s the number of gallons (or liters) of gasoline and diesel you expect to sell at your retail outlets, multiplied by the average pump price. The key is to build this from the ground up: forecast average sales per site, factor in the number of sites, and account for seasonality and local competition.
  • Non-Fuel Revenue (NFR): Don't underestimate the C-store! Convenience store sales are a critical and often higher-margin component of the marketing P&L. This requires forecasting sales for categories like beverages, tobacco, and snacks. A common method is to project sales per square foot or based on the number of customer transactions.

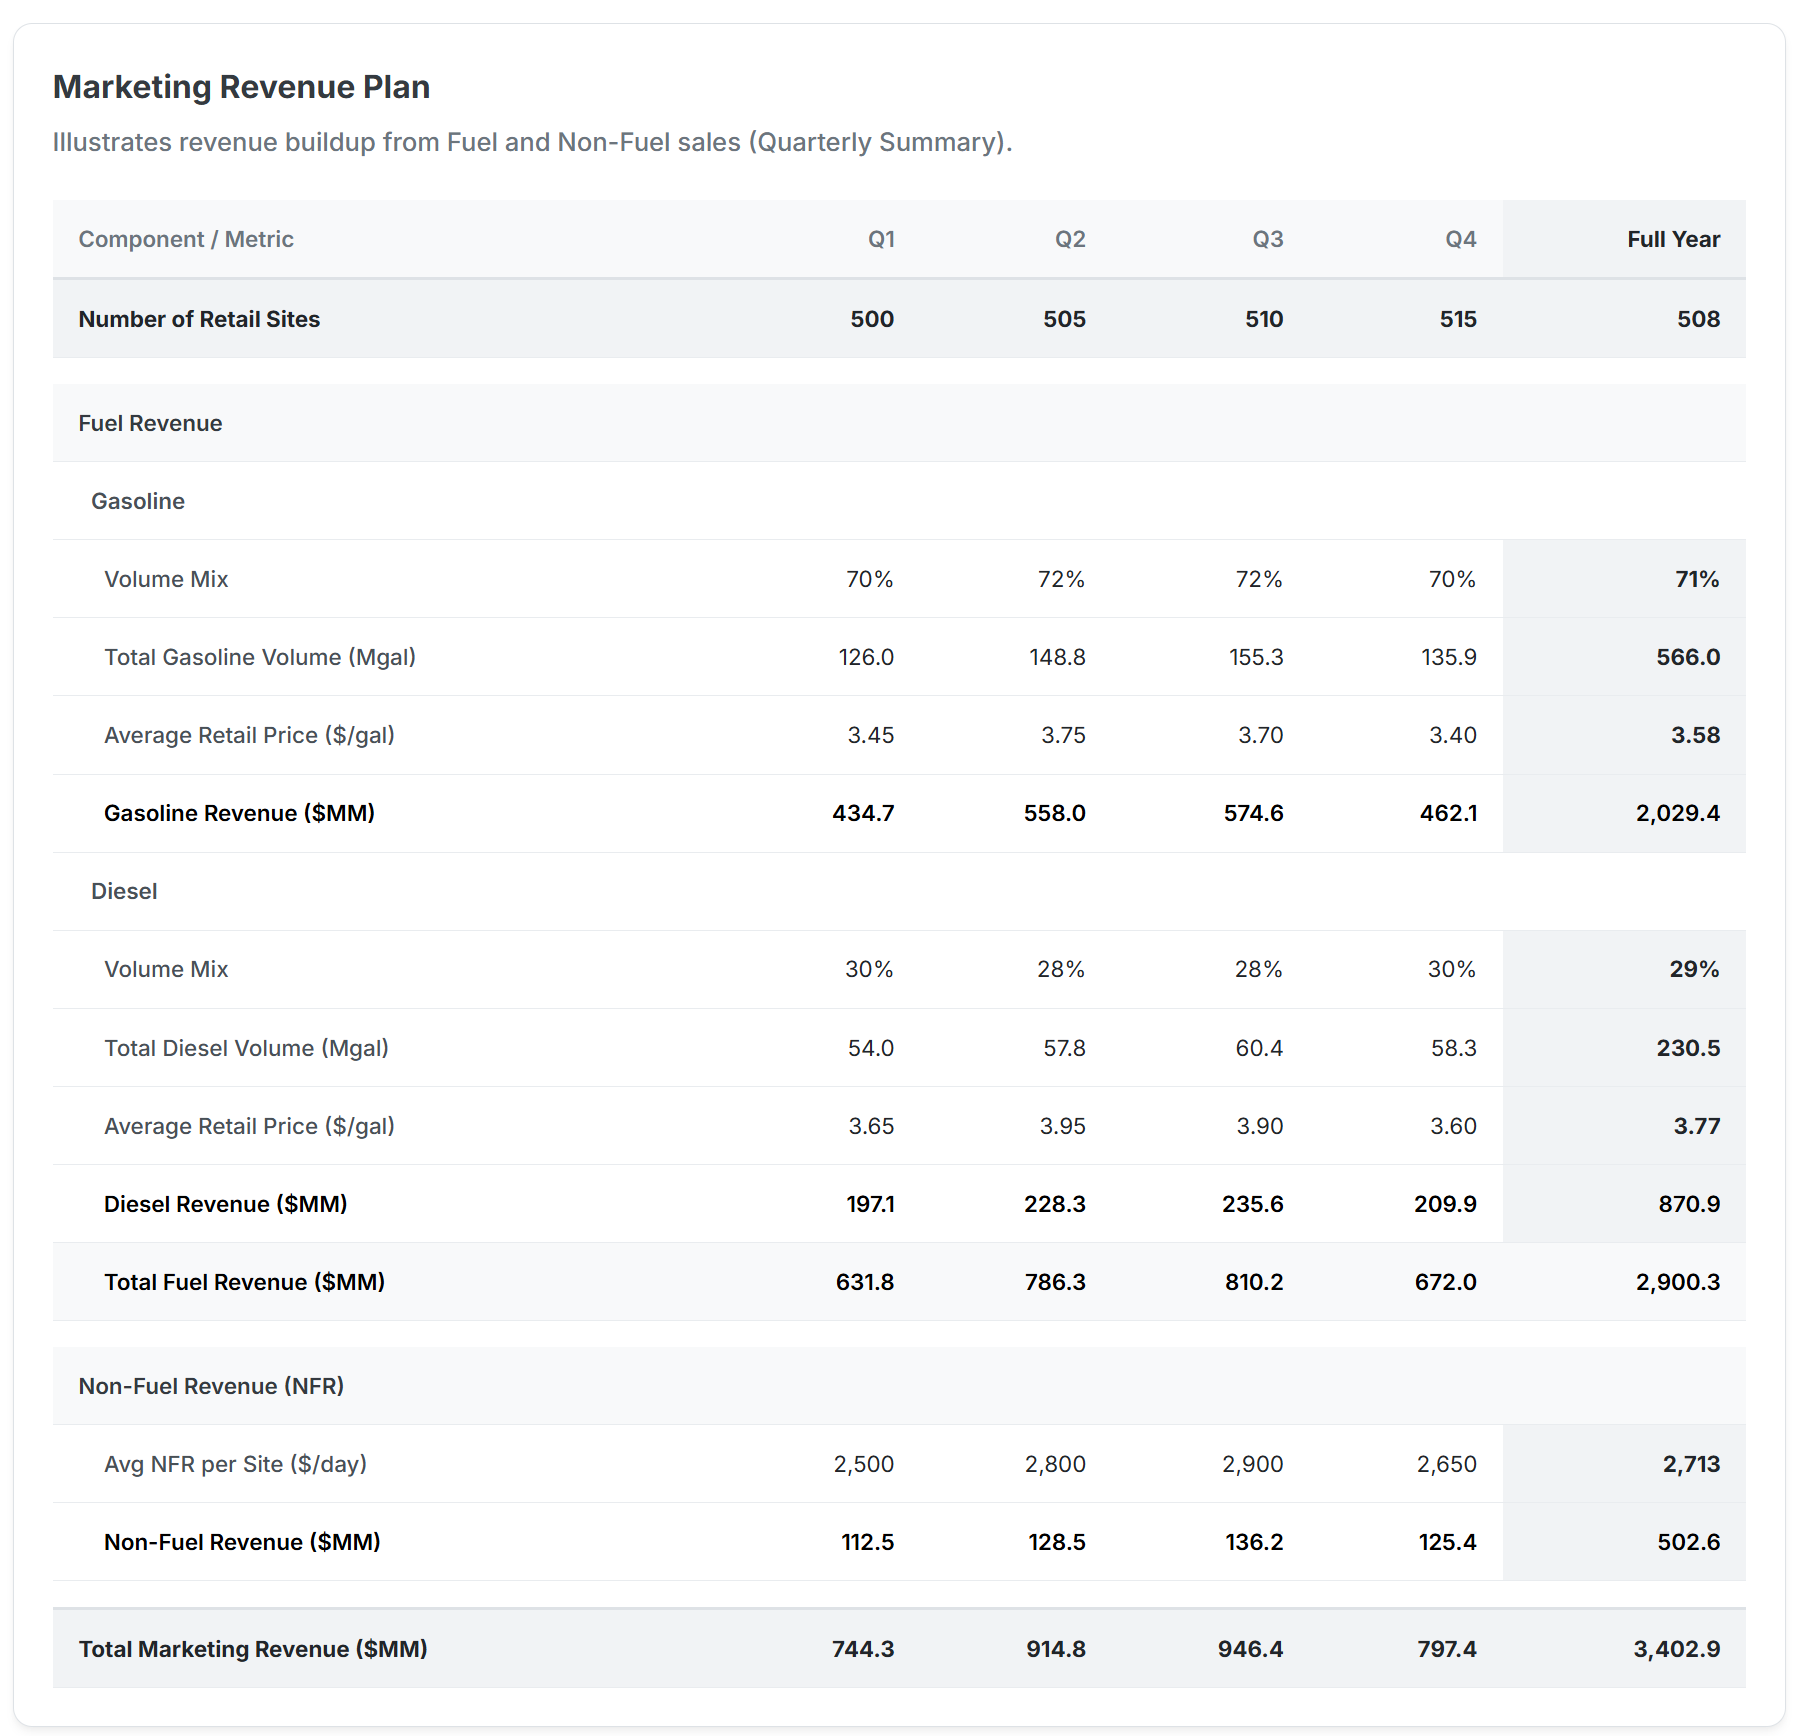
The formula used to calculate the values above are shown here.

2. The Cost Side of the Coin: Crude, Operations, and Overheads

Costs in the downstream sector are substantial and varied. Accuracy here is crucial for understanding true profitability.

Cost of Goods Sold (COGS)

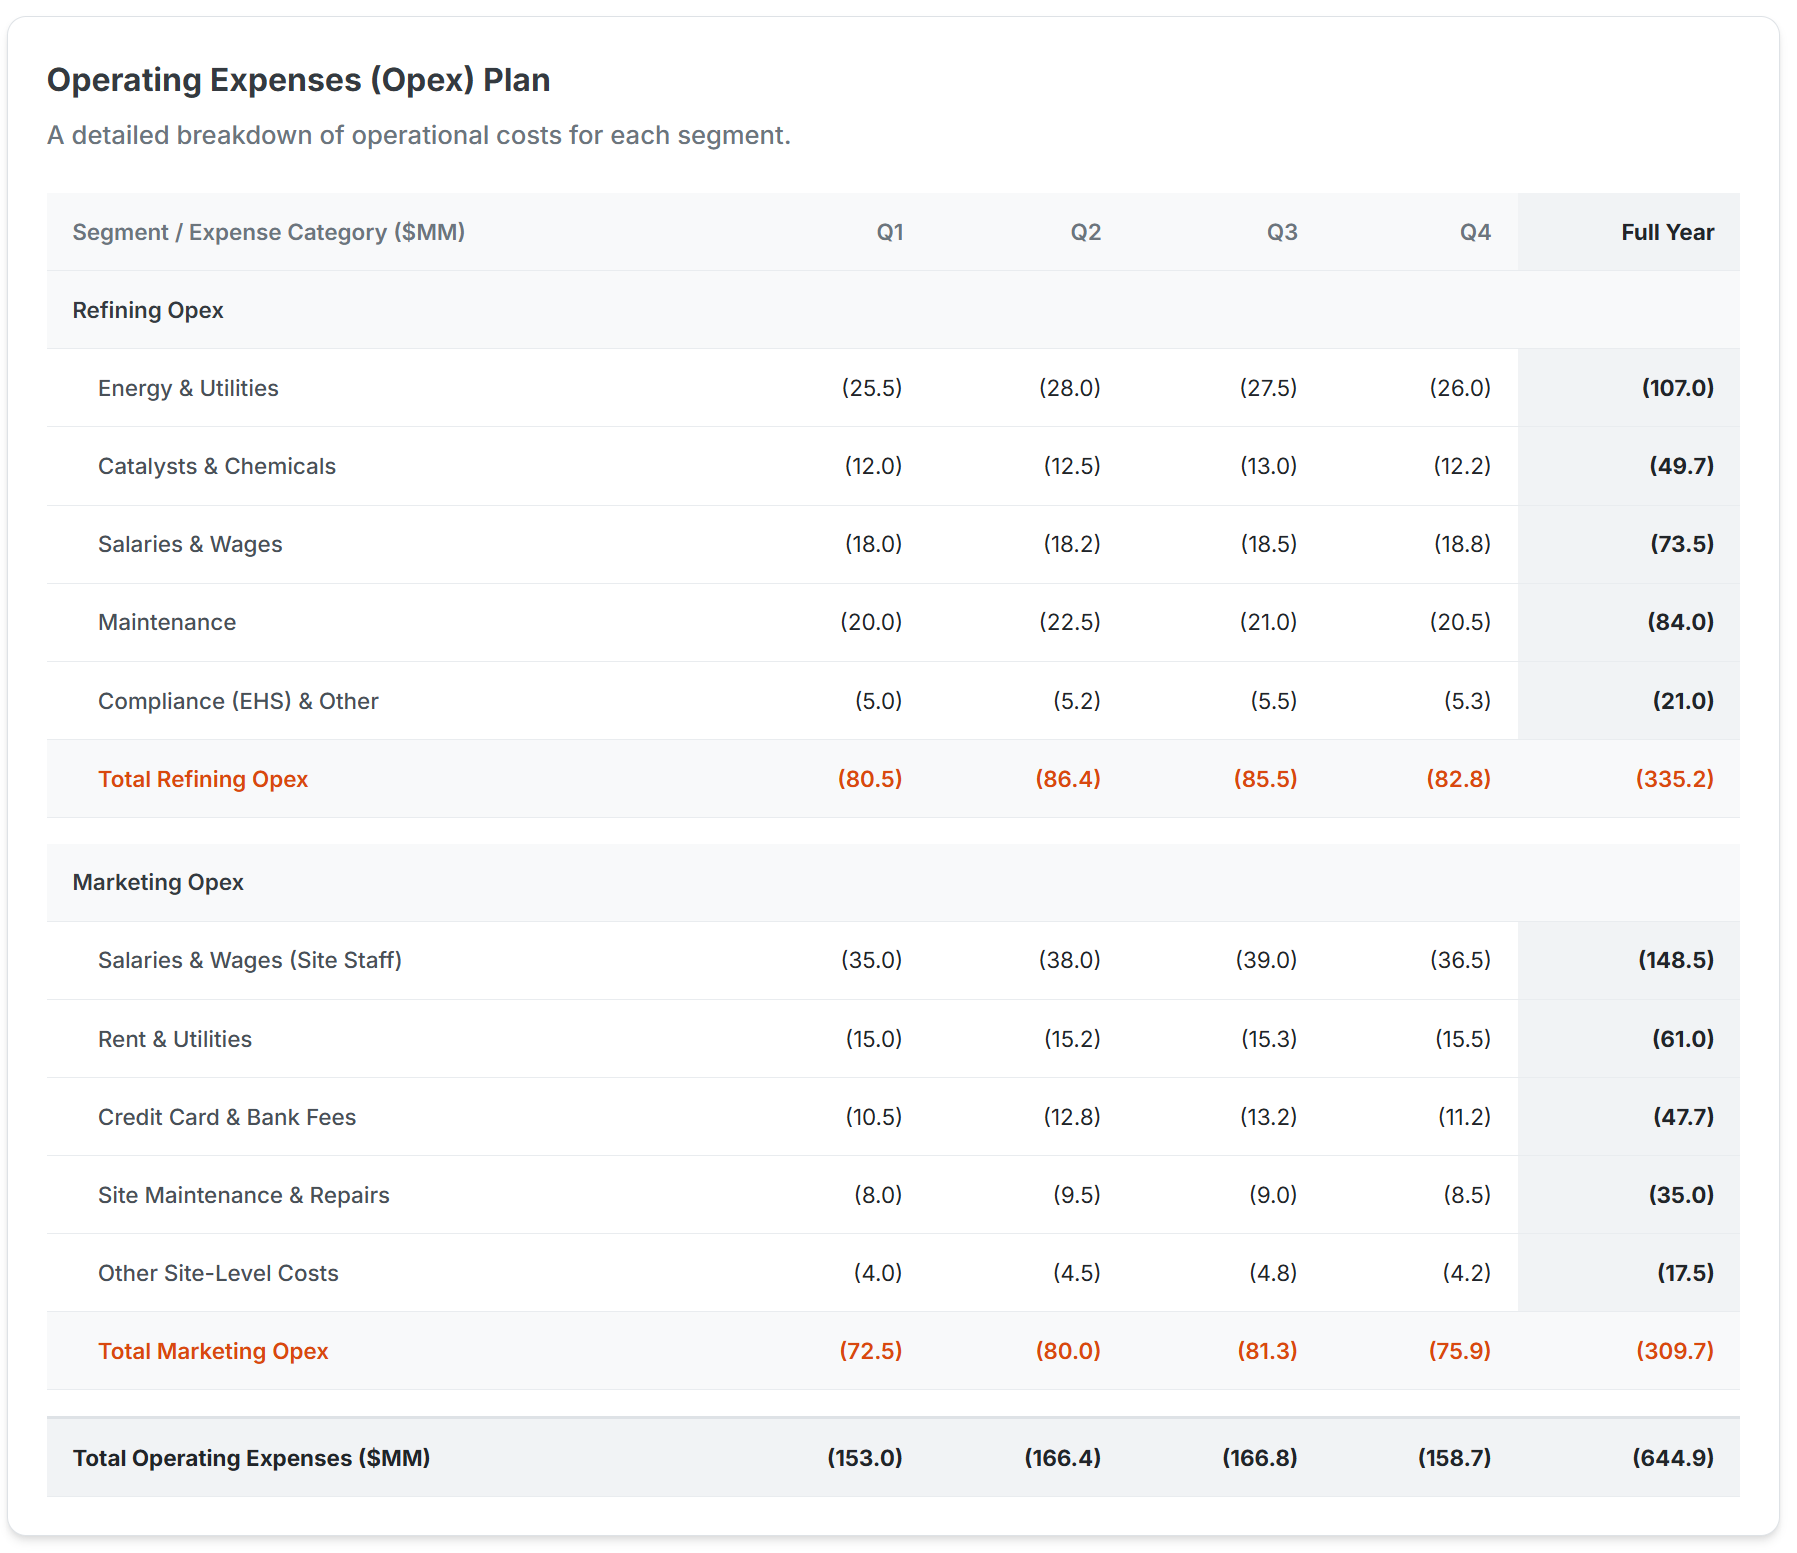
This is the largest cost component and differs significantly between refining and marketing.

  • Refining COGS: The primary driver is the cost of crude oil. This is a massive variable, subject to global geopolitics and market speculation. Your plan must forecast the price of the specific crude grades your refinery uses (e.g., WTI, Brent) and the volume you need to purchase. The COGS for the refining segment is essentially the cost of the raw material that goes into the products it sells to the marketing division or third parties.
  • Marketing COGS: For the marketing segment, the COGS is the transfer price of the fuel it "buys" from its own refining segment or from the open market. This internal transfer price is a critical assumption in your plan. Setting it too high or too low can distort the profitability of each segment, making one look artificially profitable at the expense of the other.

Operating Expenses (Opex)

These are the costs to run the physical assets.

  • Refining Opex: This includes energy costs (natural gas, electricity), catalysts and chemicals, labor, maintenance, and compliance (environmental and safety). A significant portion of these costs are fixed or semi-fixed, meaning the refinery incurs them regardless of its production level. Therefore, running the refinery at a high utilization rate is key to spreading these fixed costs over more barrels.
  • Marketing Opex: For retail sites, this includes labor, utilities, credit card fees (a significant percentage of revenue), maintenance, and rent or depreciation on the properties.

Selling, General & Administrative (SG&A)

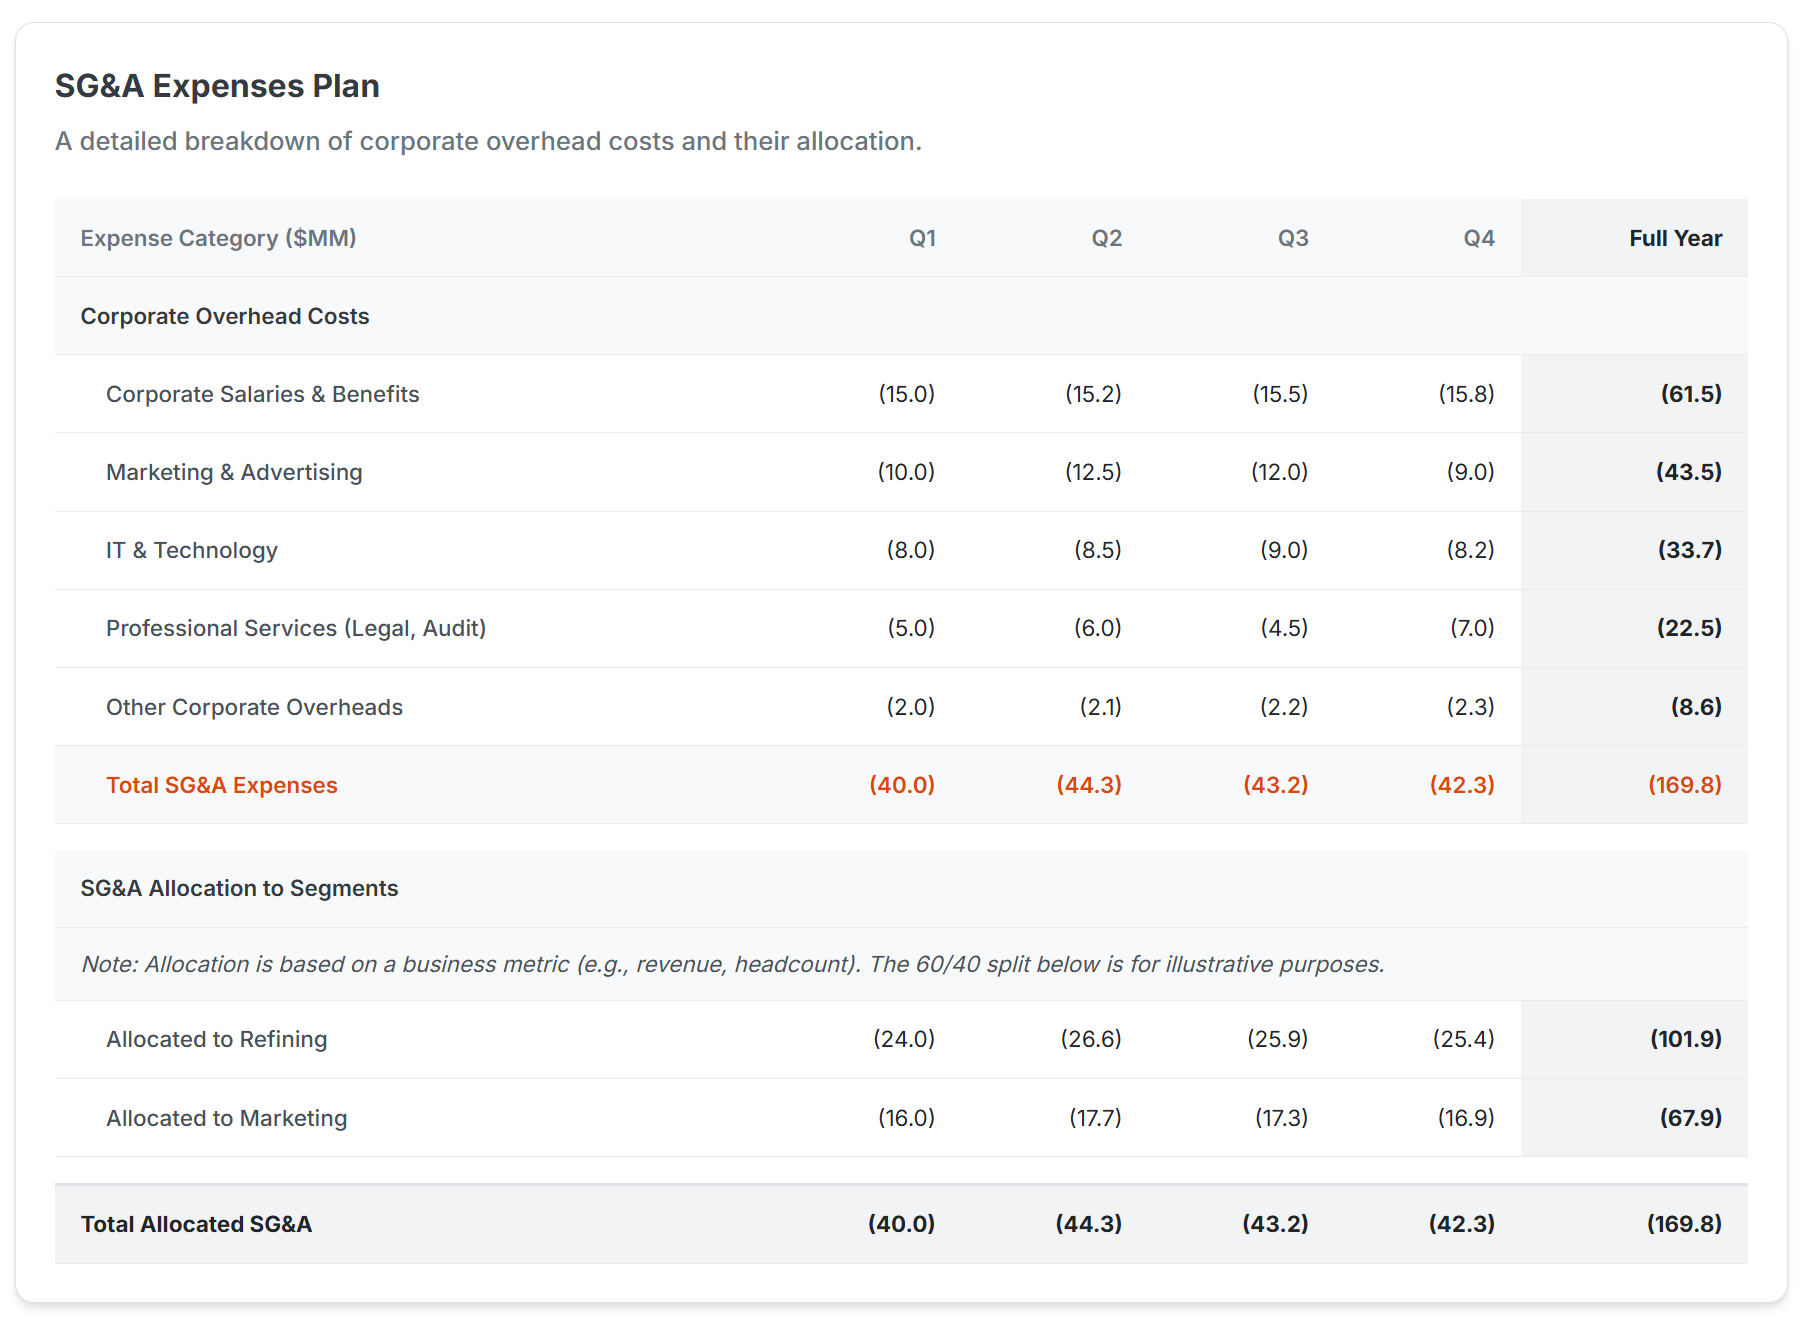
These are the corporate overheads not directly tied to production or sales, such as head office salaries, IT, marketing campaigns, and legal fees. In your plan, these are often allocated between the refining and marketing segments based on a fair metric like headcount or revenue.

3. Calculating Margin: Where Profitability is Revealed

With revenue and costs in place, we can calculate the most important KPIs for a downstream business.

  • Gross Refining Margin (GRM): This is the lifeblood of a refinery. It's the difference between the total value of the refined products produced and the cost of the crude oil input. A common metric is the GRM per barrel ($/bbl). Your financial plan should track this closely, as it measures the fundamental profitability of your core refining operation. GRM = (Revenue from Refined Products - Cost of Crude Oil) / Barrels of Crude Processed
  • Marketing Margin: This is calculated on a per-gallon basis.
    • Fuel Margin: The difference between the retail pump price and the transfer price of the fuel.
    • Non-Fuel Margin: The gross margin on convenience store sales.

A successful downstream business often uses strong marketing margins to buffer against periods of weak refining margins, and vice-versa.

4. Putting It All Together: The Consolidated P&L

Once you have built up the P&L for both the refining and marketing segments, you can consolidate them. The key is to handle the inter-company transactions properly. The revenue the refining segment records for selling fuel to the marketing segment must be eliminated during consolidation to avoid double-counting. The final consolidated P&L will show the total external revenue and total costs for the entire downstream operation.

From there, you can calculate standard metrics like EBITDA (Earnings Before Interest, Taxes, Depreciation, and Amortization) and Net Income.

Consolidated P&L Statement - Monthly Detail
A full-year financial plan. Click on header rows to expand/collapse details.
P&L Line Item ($MM)JanFebMarAprMayJunJulAugSepOctNovDecFull Year
Refining Revenue459.3440.7477.8540.1565.0543.0535.1525.0517.2480.1465.0459.86,023.1
Gasoline206.9197.6216.2270.4285.4275.5258.1252.8247.6201.1190.4185.42,792.5
Diesel134.3128.8139.7140.1148.2146.9155.1152.0148.5169.5166.4174.91,804.4
Marketing Revenue248.1236.2260.0300.1310.5304.2318.0315.1313.3270.5265.0261.93,402.9
Gasoline144.9138.8151.0182.1190.5185.4195.1192.0187.5155.4154.0152.72,029.4
Diesel65.762.969.072.577.576.080.479.178.071.168.569.2870.9
Non-Fuel37.534.540.045.542.542.842.544.047.844.042.540.0502.6
Inter-company Eliminations(189.6)(185.0)(194.2)(230.1)(245.5)(238.4)(248.0)(245.1)(241.6)(210.3)(205.0)(188.7)(2,621.5)
Consolidated Revenue517.8491.9543.6610.1630.0608.8605.1595.0588.9540.3525.0533.06,804.5
Refining COGS (Crude)(364.5)(355.0)(374.0)(400.1)(420.5)(402.0)(400.1)(395.0)(394.6)(360.5)(355.0)(358.0)(4,579.3)
Marketing COGS(215.9)(210.0)(221.7)(260.1)(275.5)(268.3)(278.0)(275.1)(276.9)(235.3)(230.0)(226.2)(2,973.3)
Gasoline(130.2)(128.8)(135.5)(165.1)(173.5)(170.3)(175.1)(172.0)(174.9)(140.3)(135.0)(130.7)(1,831.3)
Diesel(59.4)(55.0)(58.2)(65.0)(72.0)(68.0)(70.4)(69.1)(67.0)(61.0)(62.5)(62.5)(790.2)
Non-Fuel(26.3)(26.2)(28.0)(30.0)(30.0)(30.0)(32.5)(34.0)(35.0)(34.0)(32.5)(33.0)(351.8)
Inter-company Eliminations189.6185.0194.2230.1245.5238.4248.0245.1241.6210.3205.0188.72,621.5
Consolidated COGS(390.8)(380.0)(401.5)(430.1)(450.5)(431.9)(430.1)(425.0)(429.9)(385.5)(380.0)(395.5)(4,931.1)
Gross Profit127.0111.9142.1180.0179.5176.9175.0170.0159.0154.8145.0137.51,873.4
Operating Expenses (Opex)(51.0)(50.0)(52.0)(55.0)(56.4)(55.0)(55.0)(54.8)(57.0)(53.2)(52.5)(53.0)(644.9)
SG&A Expenses(13.3)(13.3)(13.4)(14.5)(15.0)(14.8)(14.5)(14.2)(14.5)(14.1)(14.1)(14.1)(169.8)
EBITDA62.748.676.7110.5108.1107.1105.5101.087.587.578.470.41,058.7
Depreciation & Amortization(16.7)(16.7)(16.7)(16.7)(16.7)(16.7)(16.7)(16.6)(16.6)(16.6)(16.6)(16.7)(200.0)
EBIT (Operating Income)46.031.960.093.891.490.488.884.470.970.961.853.7858.7
Taxes (25%)(11.5)(8.0)(15.0)(23.5)(22.9)(22.6)(22.2)(21.1)(17.7)(17.7)(15.5)(13.4)(214.7)
Net Income34.523.945.070.368.567.866.663.353.253.246.340.3644.0

A breakdown of downstream oil & gas P&L with monthly detail with detailed line items is shown below. Click the Revenue and COGS line items to see more details. You may also download the P&L to an excel file.

Beyond Spreadsheets: Why Your Downstream Business Needs EPM

Building this entire plan in a spreadsheet is possible. But managing it is another story. The oil and gas market waits for no one. Crude prices shift, consumer demand changes, and operational issues arise. A static spreadsheet-based plan quickly becomes obsolete.

This is where Enterprise Performance Management (EPM) solutions come in. A modern EPM platform, like Lumel EPM, is designed to handle the dynamism and complexity of downstream financial planning.

Here’s how Lumel EPM can help:

  • Scenario Planning & Sensitivity Analysis: What happens to your P&L if crude prices jump by $10/bbl? What if a key refinery unit goes offline for an extra week? With Lumel EPM, you can run these scenarios in minutes, not days. You can instantly see the impact on your GRM, marketing margins, and overall EBITDA, allowing you to build contingency plans.
  • Driver-Based Budgeting: Instead of just plugging in numbers, Lumel EPM allows you to create a model based on the real-world drivers of your business—crude throughput, yields, sales volumes per site, etc. When you adjust a driver, the entire P&L updates automatically and accurately.
  • Rolling Forecasts: The annual budget is often outdated by the end of the first quarter. Lumel EPM facilitates rolling forecasts, allowing you to continuously re-forecast the rest of the year based on actual performance. This creates a more agile organization that can pivot quickly to capture opportunities or mitigate risks.

In the downstream oil and gas business, the companies that win are the ones that can see around the corner. A well-structured P&L is your map, but a powerful EPM tool is the GPS that gives you real-time intelligence to navigate the journey. Building a detailed financial plan is the first step. Powering it with the right technology is what will ultimately fuel your success.


Lumel empowers downstream oil & gas businesses to move beyond spreadsheets, delivering agile, data-driven financial planning. With Lumel EPM, your P&L becomes a strategic asset—dynamic, responsive, and built for profitability. The firm was recognized as the Best Overall Vendor for EPM in 2025.  

To follow our experts and receive thought leadership insights on data & analytics, register for one of our webinars.  To learn how Lumel Enterprise Performance Management (EPM) supports new product introductions, reach out to us today. 

Request a demo

Learn how Lumel helps enterprises deliver real-time integrated reporting and planning applications

Get Lumel Brochure

Enhance your BI, analytics and xP&A use cases with our no-code Data App suite for Power BI.
Download now
Lumel
Lumel empowers enterprises to look forward and think ahead with an innovative suite of products for real-time integrated planning, reporting, and analytics. Designed for business users, Lumel delivers cutting-edge, no-code, self-service user experiences to leverage your modern data platform investments, reduce TCO, and retire legacy solutions.

Headquarters

5920 Windhaven Pkwy
Plano TX 75093
linkedin facebook pinterest youtube rss twitter instagram facebook-blank rss-blank linkedin-blank pinterest youtube twitter instagram